配置Colab开发环境
一、环境配置
这里使用Google家的colab,免费又好用。
- 登录Gooelg drive
创建colab环境
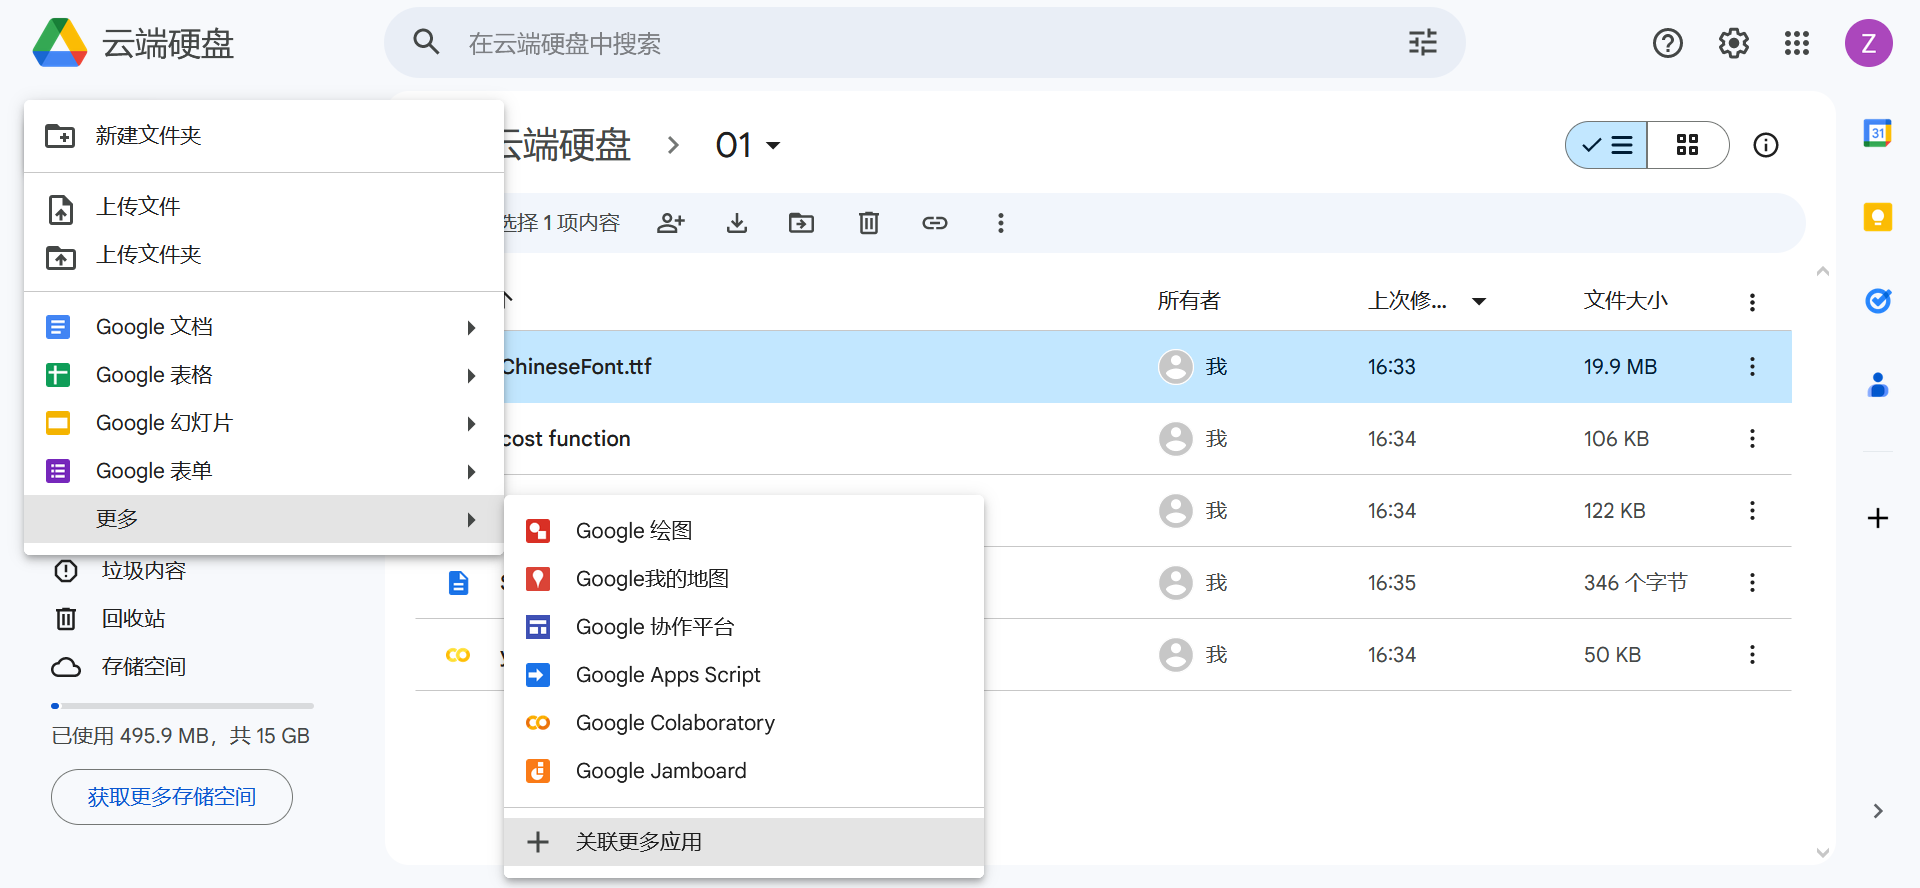
- 新建-->更多-->关联更多应用:然后应用市场搜索搜索colab
- 如果之前已经使用过colab,则更多中会出现google colaboratory
链接
- 进入环境后,点击右上角connect,链接资源环境,开始启用colab
- 开通GPU
- Edit-->notebook settins-->Hardware accelerator:选择T4 GPU,输入
!nvidia-smi然后运行,会显示以下GPU信息
- Edit-->notebook settins-->Hardware accelerator:选择T4 GPU,输入
Wed Jan 10 08:31:14 2024
+---------------------------------------------------------------------------------------+
| NVIDIA-SMI 535.104.05             Driver Version: 535.104.05   CUDA Version: 12.2     |
|-----------------------------------------+----------------------+----------------------+
| GPU  Name                 Persistence-M | Bus-Id        Disp.A | Volatile Uncorr. ECC |
| Fan  Temp   Perf          Pwr:Usage/Cap |         Memory-Usage | GPU-Util  Compute M. |
|                                         |                      |               MIG M. |
|=========================================+======================+======================|
|   0  Tesla T4                       Off | 00000000:00:04.0 Off |                    0 |
| N/A   51C    P8               9W /  70W |      0MiB / 15360MiB |      0%      Default |
|                                         |                      |                  N/A |
+-----------------------------------------+----------------------+----------------------+

+---------------------------------------------------------------------------------------+
| Processes:                                                                            |
|  GPU   GI   CI        PID   Type   Process name                            GPU Memory |
|        ID   ID                                                             Usage      |
|=======================================================================================|
|  No running processes found                                                           |
+---------------------------------------------------------------------------------------+
二、使用Drive资源
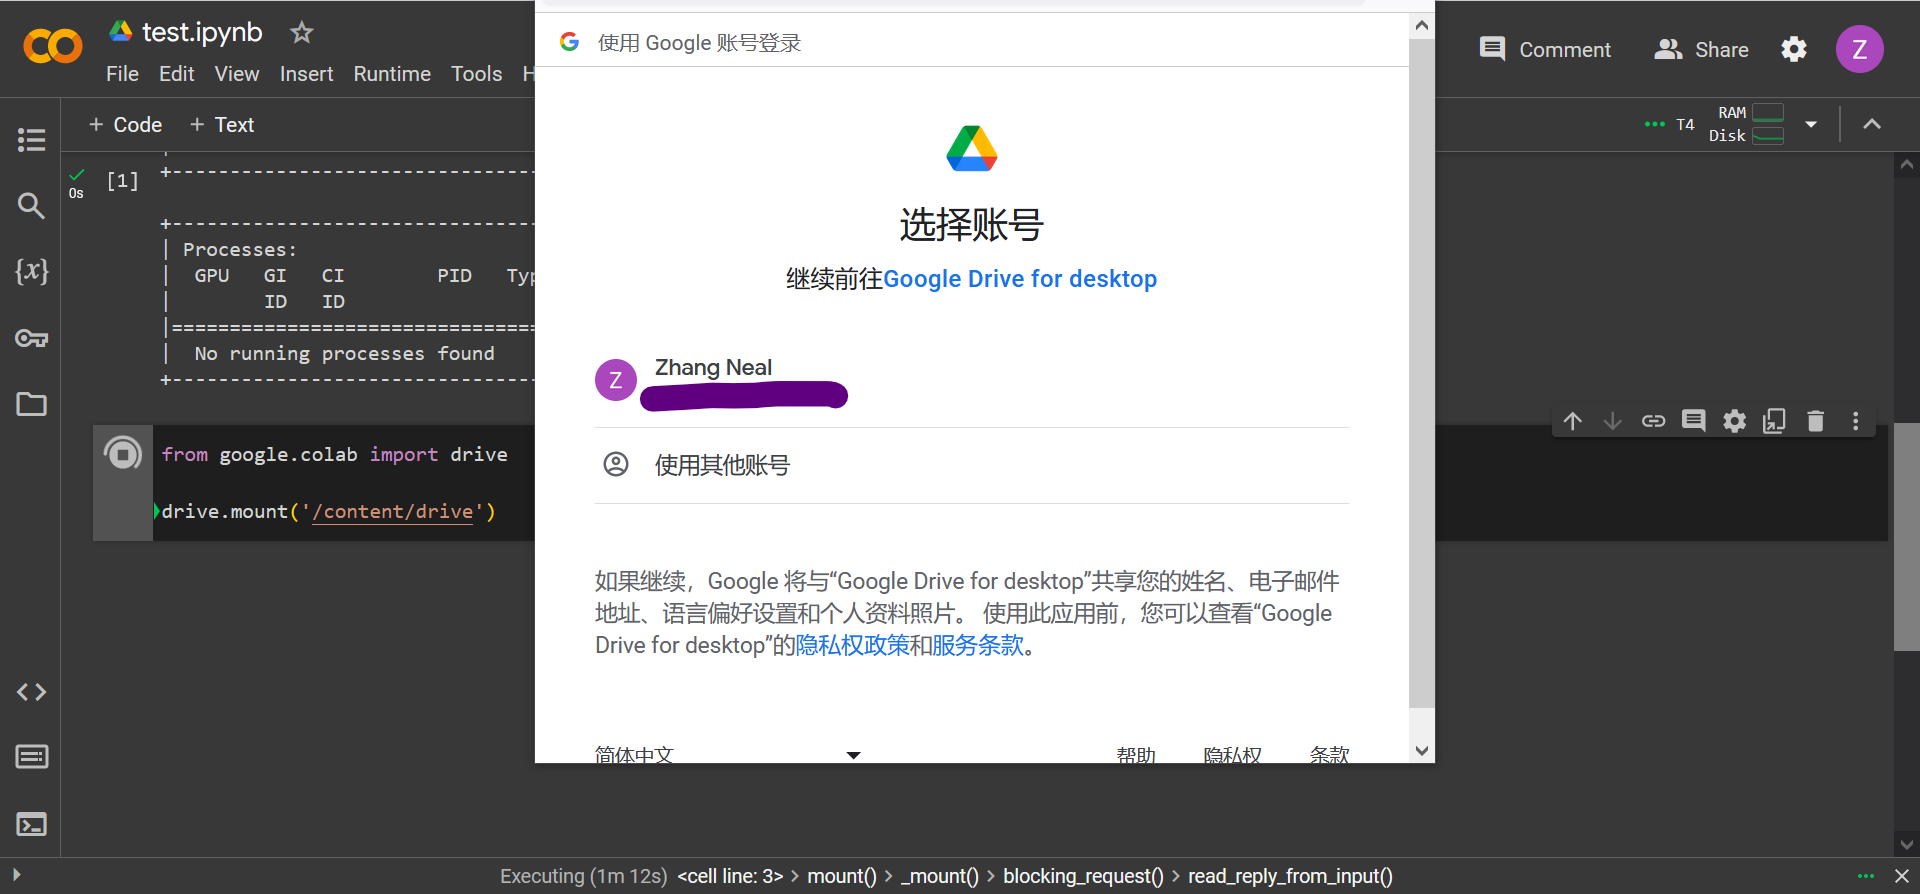
- 挂载drive
运行下列代码时,会提示要求授权
from google.colab import drive
drive.mount('/content/drive')
- 挂载成功后会返回
Drive already mounted at /content/drive; to attempt to forcibly remount, call drive.mount("/content/drive", force_remount=True). 挂载后drive的根路径为:
/content/drive/My Drive,我的文件是在drive的子目录下,所以完整路径为:/content/drive/My Drive/01/Salary_Data.csv使用drive资源
import pandas as pd
url='/content/drive/My Drive/01/Salary_Data.csv'
print(pd.read_csv(url))
使用pandas读取csv表格后会返回表格内容
YearsExperience  Salary
0               0.3    36.2
1               0.6    36.6
2               0.8    42.8
3               1.1    39.3
4               1.3    46.2
5               1.5    37.7
6               2.0    43.5
7               2.2    39.8
8               2.9    56.6
9               3.0    60.1
10              3.2    54.4
11              3.2    64.4
12              3.7    57.1
13              3.9    63.2
14              4.0    55.7
15              4.0    56.9
16              4.1    57.0
17              4.5    61.1
18              4.9    67.9
19              5.1    66.0
20              5.3    83.0
21              5.9    81.3
22              6.0    93.9
23              6.8    91.7
24              7.1    98.2
25              7.9   101.3
26              8.2   113.8
27              8.7   109.4
28              9.0   105.5
29              9.5   116.9
30              9.6   112.6
31             10.3   122.3
32             10.5   121.8
三、安装中文字体
默认情况下,colab无法显示中文,需要自行安装字体
如果没有中文字体,在matplotlib中使用汉字,会报错.
/usr/local/lib/python3.10/dist-packages/IPython/core/pylabtools.py:151: UserWarning: Glyph 24180 (\N{CJK UNIFIED IDEOGRAPH-5E74}) missing from current font.
  fig.canvas.print_figure(bytes_io, **kw)
/usr/local/lib/python3.10/dist-packages/IPython/core/pylabtools.py:151: UserWarning: Glyph 36164 (\N{CJK UNIFIED IDEOGRAPH-8D44}) missing from current font.
  fig.canvas.print_figure(bytes_io, **kw)
/usr/local/lib/python3.10/dist-packages/IPython/core/pylabtools.py:151: UserWarning: Glyph 25955 (\N{CJK UNIFIED IDEOGRAPH-6563}) missing from current font.
  fig.canvas.print_figure(bytes_io, **kw)
/usr/local/lib/python3.10/dist-packages/IPython/core/pylabtools.py:151: UserWarning: Glyph 28857 (\N{CJK UNIFIED IDEOGRAPH-70B9}) missing from current font.
  fig.canvas.print_figure(bytes_io, **kw)
/usr/local/lib/python3.10/dist-packages/IPython/core/pylabtools.py:151: UserWarning: Glyph 22270 (\N{CJK UNIFIED IDEOGRAPH-56FE}) missing from current font.
  fig.canvas.print_figure(bytes_io, **kw)
- 安装字体
安装字体前需要安装wget,使用wget下载字体
这里下载的字体是ChineseFont.ttf
!pip install wget
import wget
wget.download("https://drive.usercontent.google.com/download?id=10SXzZFfsoMTC9b7UZLnfse7tIprMI8Bh&export=download&authuser=0&confirm=t&uuid=ccf99670-d41f-4cb9-aaa6-1516a85097ea&at=APZUnTU8zDUUTF7m46xF5zVcYb04:1704939398929")
字体安装成功后,会有一个输出提示
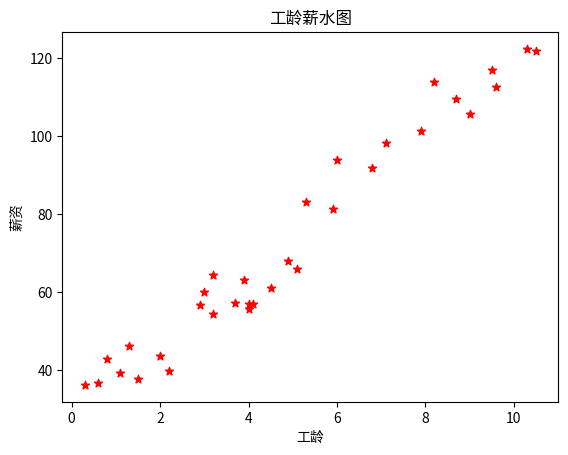
Requirement already satisfied: wget in /usr/local/lib/python3.10/dist-packages (3.2)
ChineseFont.ttf
使用字体
import matplotlib.pyplot as plt
import pandas as pd
import matplotlib as mlp
from matplotlib.font_manager import fontManager
fontManager.addfont("ChineseFont.ttf")
mlp.rc("font",family="ChineseFont")
url='/content/drive/My Drive/01/Salary_Data.csv'
dataframe=pd.read_csv(url)
x=dataframe['YearsExperience']
y=dataframe['Salary']
plt.title("工龄薪水图")
plt.xlabel("工龄")
plt.ylabel("薪资")
plt.scatter(x,y,marker="*",color="red",label="真实数据")
plt.show()